Python example to capture image from Raspberry Pi Camera Module with picamera, display on OpenCV and matplotlib.
This demo run on Windows log-in Raspberry Pi 2/Raspbian remotely, so the preview will not shown.
pyCV_picam.py
import picamera
import picamera.array
import time
import cv2
from matplotlib import pyplot as plt

with picamera.PiCamera() as camera:
    cap=picamera.array.PiRGBArray(camera)
    camera.resolution = (640, 480)
    camera.start_preview()
    time.sleep(3)
    camera.capture(cap,format="bgr")
    img=cap.array

#- display on OpenCV window -
cv2.namedWindow('imageWindow', cv2.WINDOW_AUTOSIZE)
cv2.imshow('imageWindow',img)
cv2.waitKey(0)
cv2.destroyAllWindows()

#- display with matplotlib
#plt.figure().canvas.set_window_title("Hello Raspberry Pi")
#plt.imshow(cv2.cvtColor(img, cv2.COLOR_BGR2RGB))
#plt.xticks([]), plt.yticks([])  # to hide tick values on X and Y axis
#plt.show()
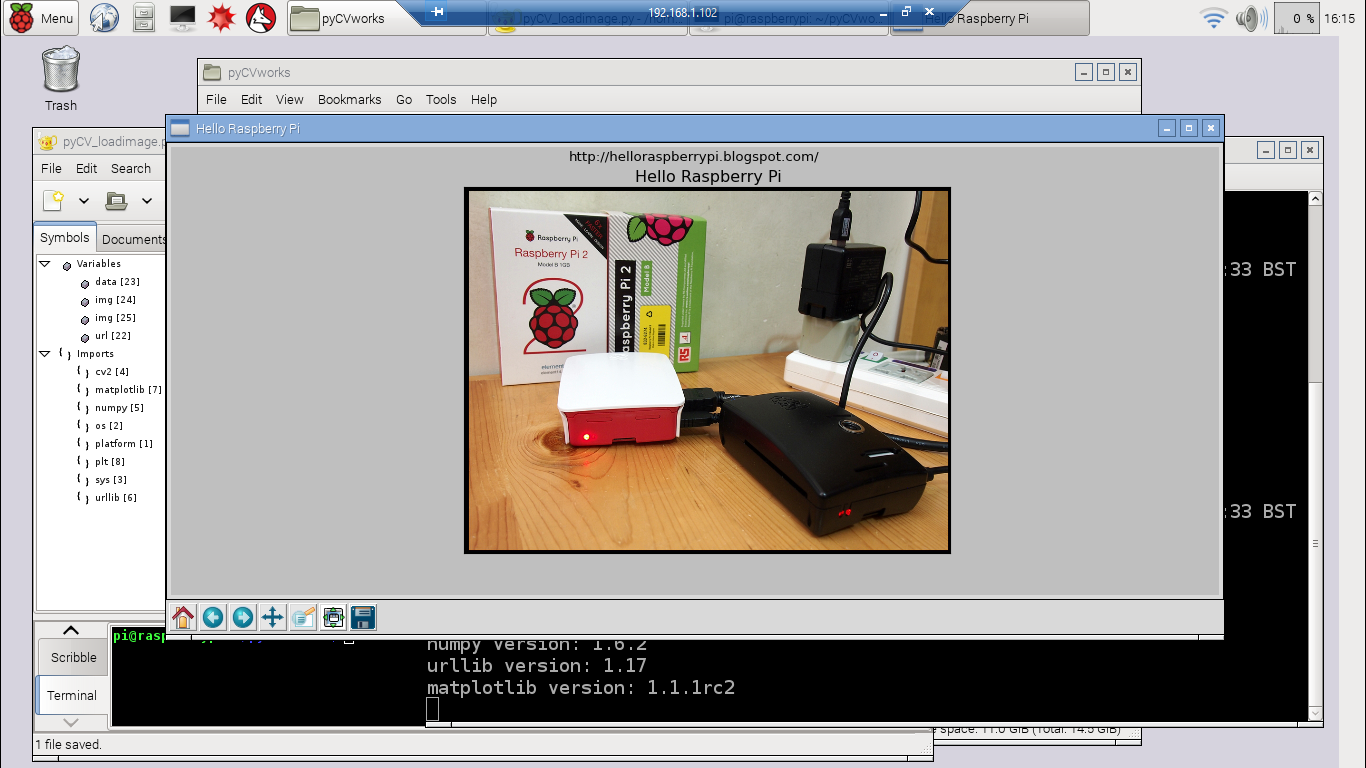
With OpenCV image displayed using matplotlib pyplot, we can resize the window, also save the image on storage. This Python example run on Raspberry Pi 2, show how to load JPG image from internet, display on pyplot, save to local storage in PNG format, then open and display the saved local image.
import platform
import os
import sys
import cv2
import numpy
import urllib
import matplotlib
from matplotlib import pyplot as plt

print platform.system(), platform.release(), platform.dist()
print os.uname()
print("Python version: \n" + sys.version)
print("cv2 version: " + cv2.__version__)
print("numpy version: " + numpy.__version__)
print("urllib version: " + urllib.__version__)
print("matplotlib version: " + matplotlib.__version__)

#- load image from local file
#img = cv2.imread('test.png', cv2.IMREAD_UNCHANGED)

#- load image from internet
url = 'http://goo.gl/41cgQr'
data = urllib.urlopen(url)
img = numpy.asarray(bytearray(data.read()), dtype='uint8')
img = cv2.imdecode(img, cv2.IMREAD_COLOR)

#- display on OpenCV window -
#cv2.namedWindow('imageWindow', cv2.WINDOW_AUTOSIZE)
#cv2.imshow('imageWindow', img)
#cv2.waitKey(0)
#cv2.destroyWindow('imageWindow')

#- display with matplotlib
#set window title of matplotlib plt
plt.figure().canvas.set_window_title("Hello Raspberry Pi")
#-- incorrect color
#plt.imshow(img, cmap = 'gray', interpolation = 'bicubic')
#-- correct color with cv2.cvtColor()
plt.imshow(cv2.cvtColor(img, cv2.COLOR_BGR2RGB))
plt.xticks([]), plt.yticks([])  # to hide tick values on X and Y axis
plt.title("Hello Raspberry Pi")
plt.suptitle("http://helloraspberrypi.blogspot.com/")

plt.show()